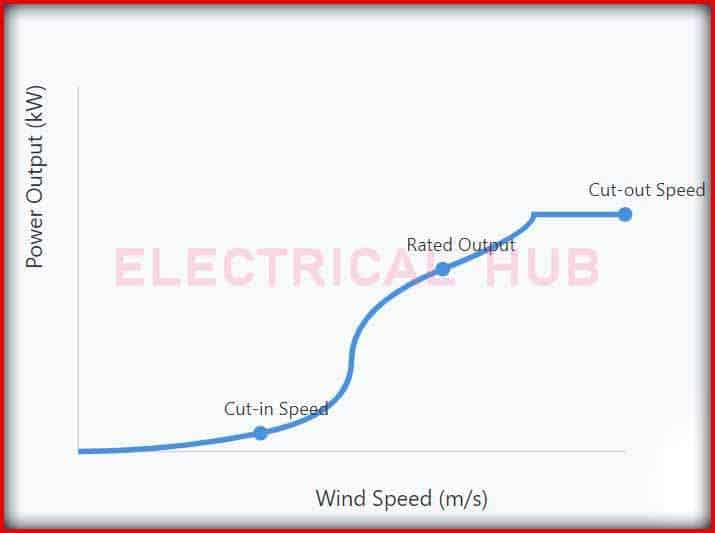
Detailed Analysis of Wind Turbine Power Curve Regions
The operational behavior of a wind turbine varies significantly across different wind speed ranges, creating distinct regions on the wind turbine power curve. Understanding these regions is crucial for wind turbine design projects and operational management. Each region represents unique challenges and opportunities for power generation optimization.

Table of Contents
Wind Turbine Power Curve Regions
The Starting Region in Wind Turbine Power Curve: Below Cut-in Speed
The behavior of a wind turbine at low wind speeds presents an interesting engineering challenge. When wind speeds are below the cut-in threshold, typically ranging from 3 to 5 meters per second, the turbine remains in a standby state. During this period, while no power is generated, the turbine’s systems remain active and vigilant.
The control computers continue their monitoring functions, sensors maintain their watch over various parameters, and the yaw system stays prepared to orient the turbine when conditions become favorable. This standby operation actually consumes a small amount of power from the grid, usually between 1 to 2 kilowatts, depending on the turbine size and sophistication of its control systems.
The Power Optimization Region
Once the wind speed exceeds the cut-in threshold, the turbine enters its most dynamic operational phase. This region, often called the partial load region, represents the heart of the turbine’s power generation capabilities. The relationship between wind speed and power output in this region follows a cubic function, making it particularly sensitive to wind speed changes. Engineers design the control systems in this region to continuously optimize the power coefficient (Cp) by adjusting the rotor speed relative to the wind speed.
The behavior in this region can be described by a sophisticated control algorithm that maintains the optimal tip speed ratio. The controller adjusts the generator torque to keep the rotor speed at its optimal point for maximum power extraction.
This relationship follows the equation Popt = Kopt × ω³, where Kopt represents the optimal gain constant derived from the turbine’s design parameters, and ω is the rotor speed. The control system must balance the competing demands of power optimization and mechanical load management, as rapid changes in wind speed can create significant structural stresses.
The Rated Power Region
As wind speeds approach and reach the rated wind speed, typically between 12 to 15 meters per second, the turbine enters a critical operational phase. At this point, the generator reaches its designed capacity, and the control strategy shifts dramatically from power optimization to power regulation. The main objective becomes maintaining constant power output despite increasing wind speeds. This regulation is achieved through a sophisticated interplay of blade pitch control and generator torque management.
The pitch control system continuously adjusts the blade angles to maintain rated power output while minimizing mechanical loads. Modern turbines can adjust their blade pitch angles with remarkable precision, often capable of changes of several degrees per second. This rapid response capability is essential for maintaining stable power output in turbulent wind conditions. The control system must anticipate and respond to wind speed changes while ensuring smooth operation and preventing excessive mechanical stresses on the turbine components.
High Wind Speed Operation
As wind speeds increase beyond the rated speed, the turbine’s control systems face their greatest challenge. The available power in the wind continues to increase with the cube of wind speed, but the turbine must maintain constant power output at its rated capacity. This requires increasingly aggressive blade pitching to spill excess wind energy. The control system must balance multiple objectives: maintaining rated power output, preventing generator overload, and protecting the turbine from excessive mechanical loads.
The turbine continues this operation until reaching its cut-out wind speed, typically around 25 meters per second. At this point, the risks of mechanical damage from high winds outweigh the benefits of continued operation. The shutdown sequence involves a carefully choreographed series of actions: the blades pitch to their feather position to minimize wind loads, the generator disconnects from the grid, and mechanical brakes engage to prevent rotor rotation.
Transitional Behaviors
The transitions between these operational regions represent particularly challenging aspects of turbine control. The control system must manage these transitions smoothly to prevent power output fluctuations and minimize mechanical stresses on turbine components. This is especially critical during the transition from below cut-in speed to power generation, and when approaching cut-out conditions in high winds.
Modern turbine control systems employ sophisticated algorithms that anticipate these transitions and prepare the turbine accordingly. For example, when wind speeds approach the cut-in threshold, the control system begins preparing the turbine by adjusting blade pitch and generator settings before actual power generation begins. Similarly, as wind speeds approach cut-out conditions, the system may begin gradual power reduction and blade feathering to ensure a smooth shutdown process.
Understanding these operational regions on wind turbine power curve and their transitions is fundamental to wind turbine design projects. This knowledge influences everything from component specification and control system design to maintenance scheduling and performance monitoring. Engineers must consider how their design choices will affect the turbine’s behavior in each region while ensuring reliable operation across the entire wind speed range.
Worth Read Posts
- Wind Energy
- Smart Grid
- Wind Turbine Design With Example
- Wind Turbine Charge Controller
- Wind Turbine Capacity
- Wind Turbine Design Ideas
- Fading and Attenuation
- CR2032 vs CR2450
- CR2450N Battery
- CR2450 Battery Equivalent
Follow us on LinkedIn, “Electrical Insights,” to get the latest updates on Electrical Engineering.


